PiSwift
PiSwift App uses the Monte Carlo method to approximate the value of pi.
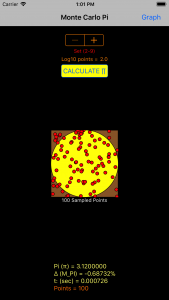
A circle inscribed in a square of area 1 has an area of π x r2 = π / 4. Thus the ratio of the number of random points landing in the circle to the number of total points in the square, times 4, approximates π.
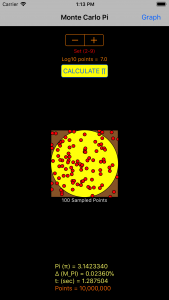
This app generates a total number of random points ranging over seven orders of magnitude. It enables the user to see the value of pi evolve through plots of pi, and delta, the percentage difference between the calculated pi value and the value of pi (M_PI) stored in the computer (∆ = [(π – M_PI)/M_PI x 100]). It also presents a scatter plot of sampled points to aid in visualizing the process, and calculates how long it takes for your device to generate the random points and do the calculation.
It’s not the fastest, most accurate or most sophisticated method known to approximate pi, but it is fun to watch the value of pi “evolve” as more random points are used, and observe how few points are needed to come close to the actual value.
INSTRUCTIONS:
Load PiSwift app, choose number of points with stepper, press Calculate π.
Main screen scatter plot presents 100 sampled points of equally spaced data (see below).
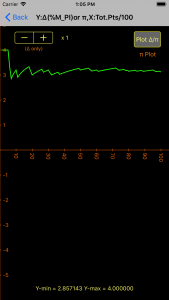
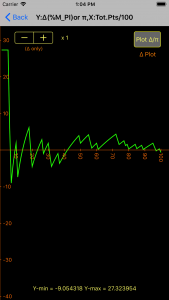
Press Graph button to observe the evolution of pi or ∆ (toggle) in graphical form.
Double tap gesture changes the origin of the graph, pan moves the graph.
Pinch gesture at > 45º scales the Y axis, and at < 45º scales the X axis (independently).
Stepper in Graph view allows for the independent scaling of ∆ (Y axis, to x200).
USAGE TIPS:
Start with a low number of points to initially see how long your iOS device takes to perform the calculation.
Use that number to predict the time required for a larger number of points (older devices take many minutes for upper limits).
Graph shows values of pi or ∆ after the sampling interval. If Log10 points = 2, pi or ∆ are calculated after every point. If Log10 points = 3, pi or ∆ are calculated every 10 points. If Log10 points = 4, it calculates values every 100 points, etc.
If you dislike your graph adjustments, toggling the Back/Graph button resets the graph to original values, without re-calculating pi.